One of the most common questions I get before a project kicks off is some version of: "So what exactly do I get at the end of this?" It's a fair question. Drone mapping produces a range of technical outputs, and if you haven't worked with aerial data before, the terminology — orthomosaic, point cloud, DSM, DTM, DXF — can feel like alphabet soup. This article breaks down each deliverable in plain terms: what it is, what it looks like, and what you'd actually use it for.
The short version: a drone mapping project typically produces a combination of visual maps, elevation data, 3D models, and engineering-ready files. Which ones you receive depends on your project scope and what your team needs downstream. Here's what each one means.
Orthomosaic Map
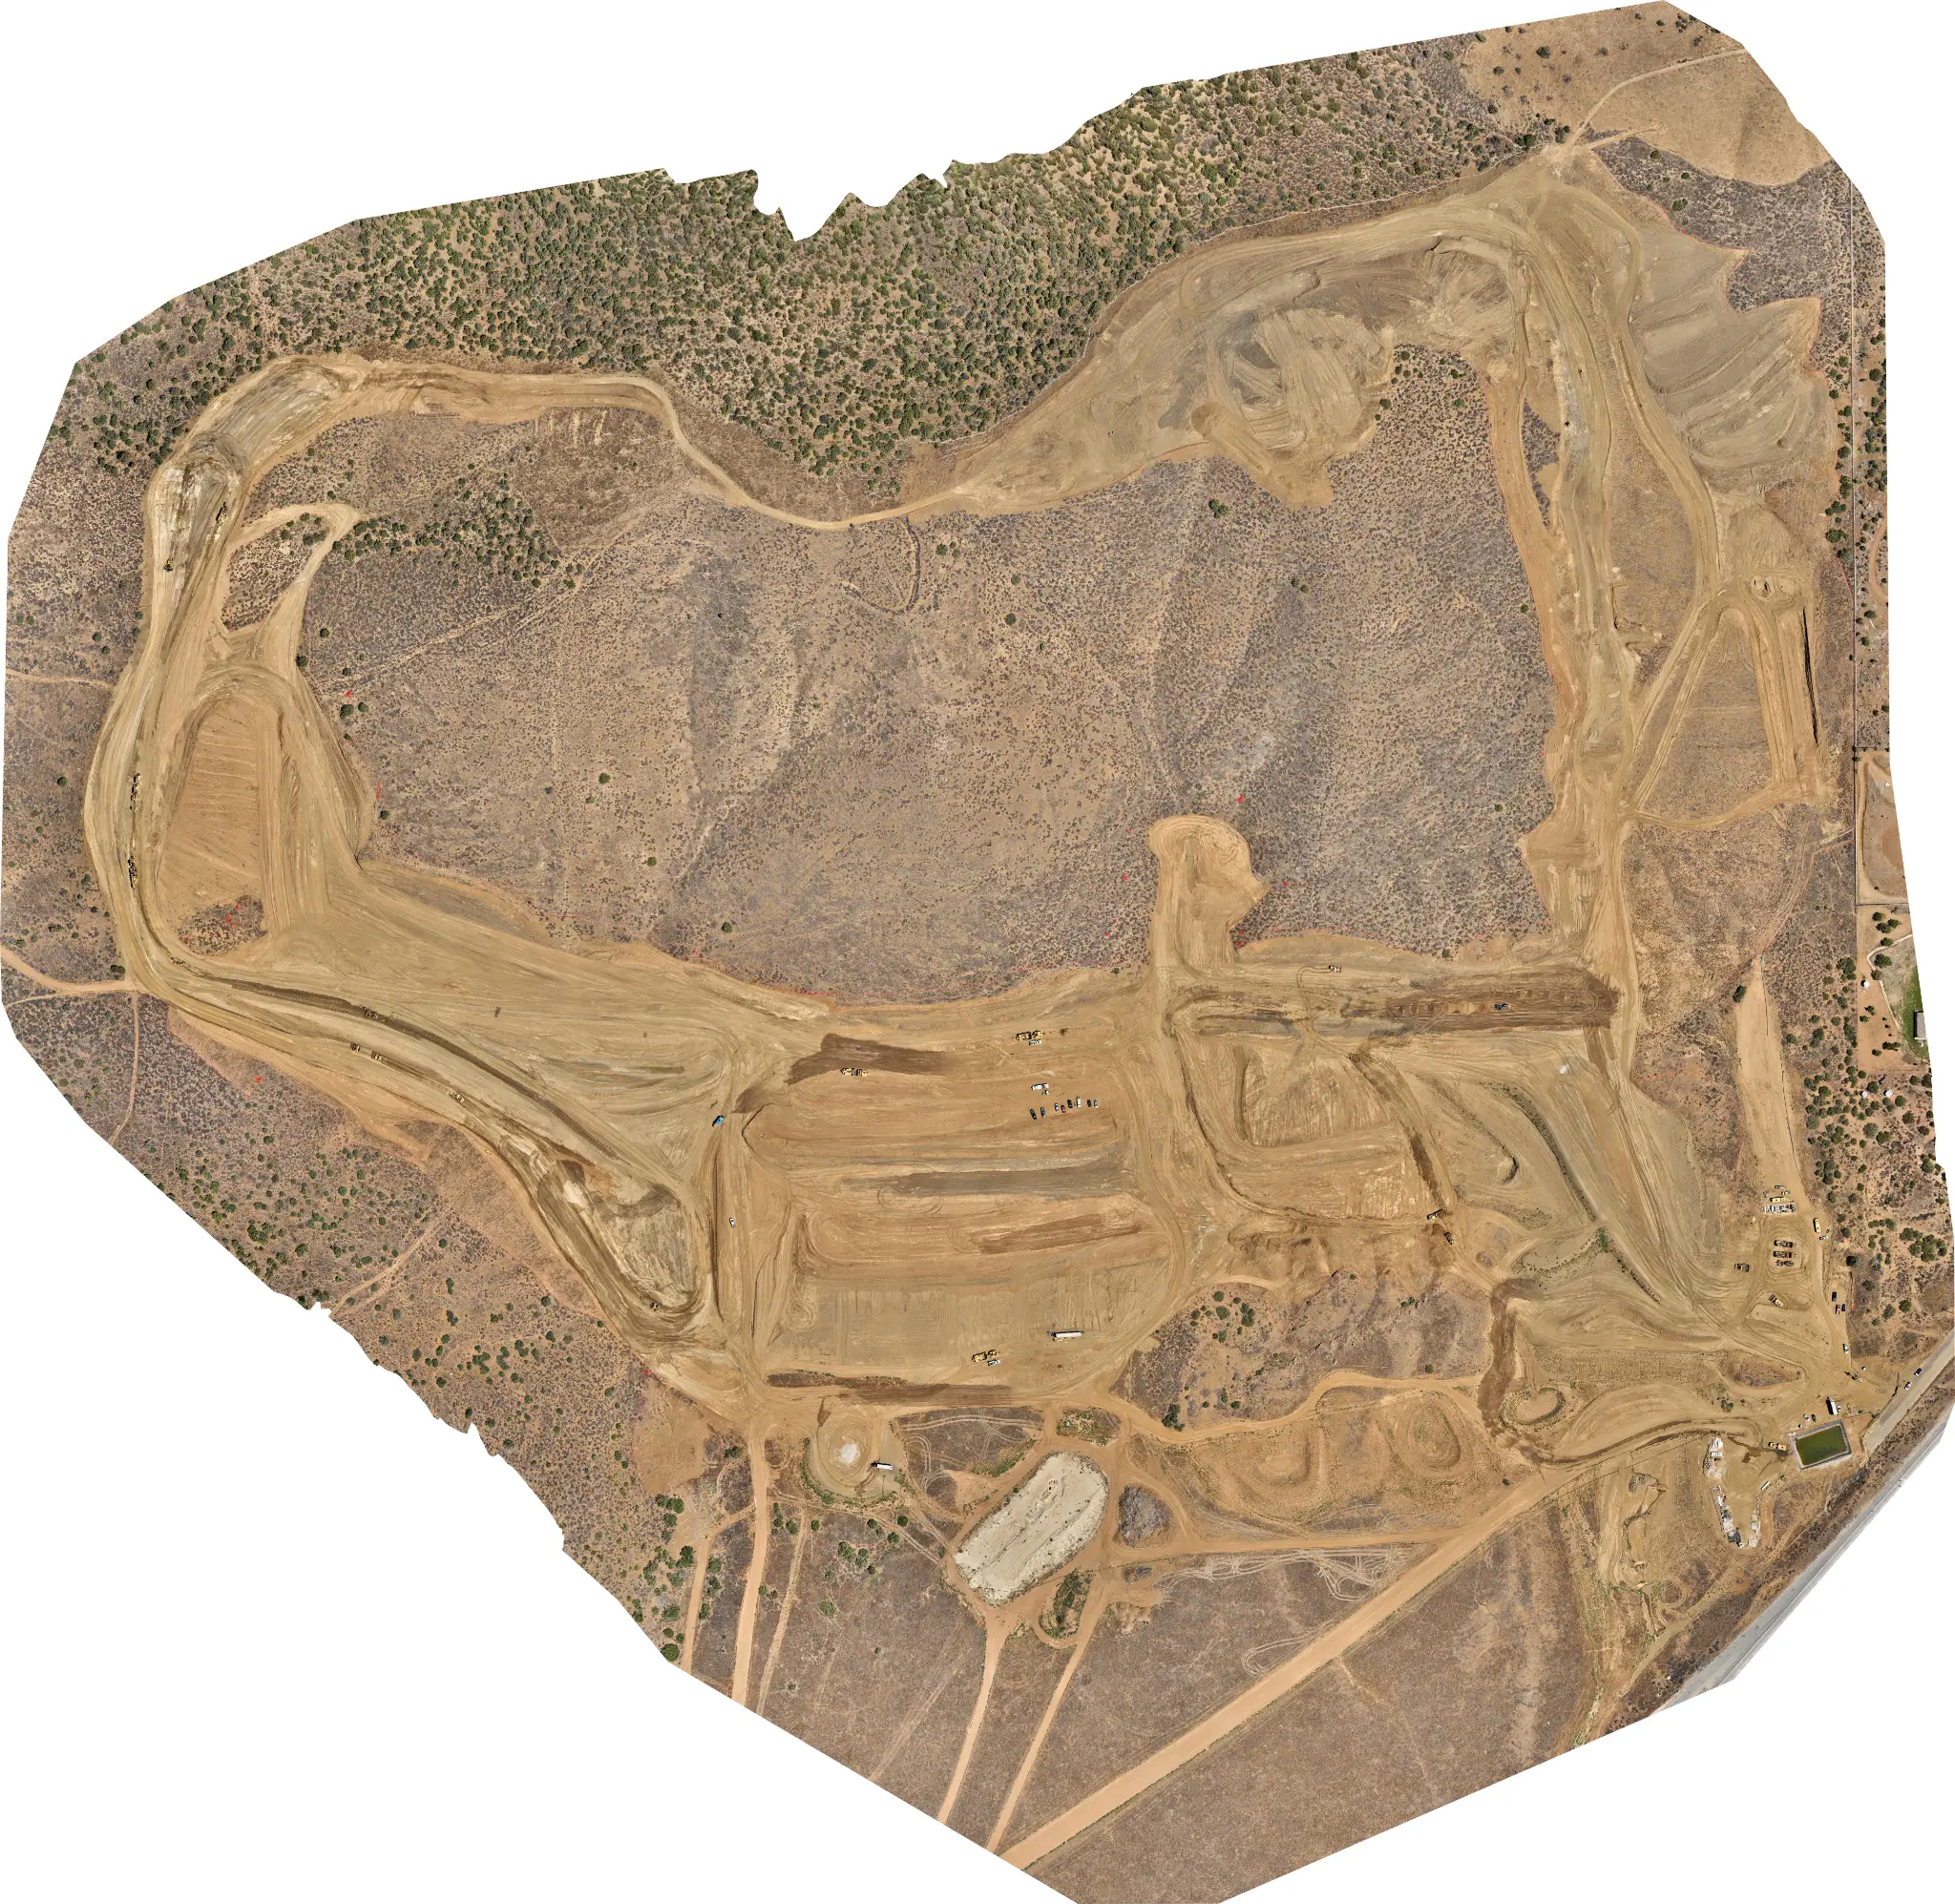
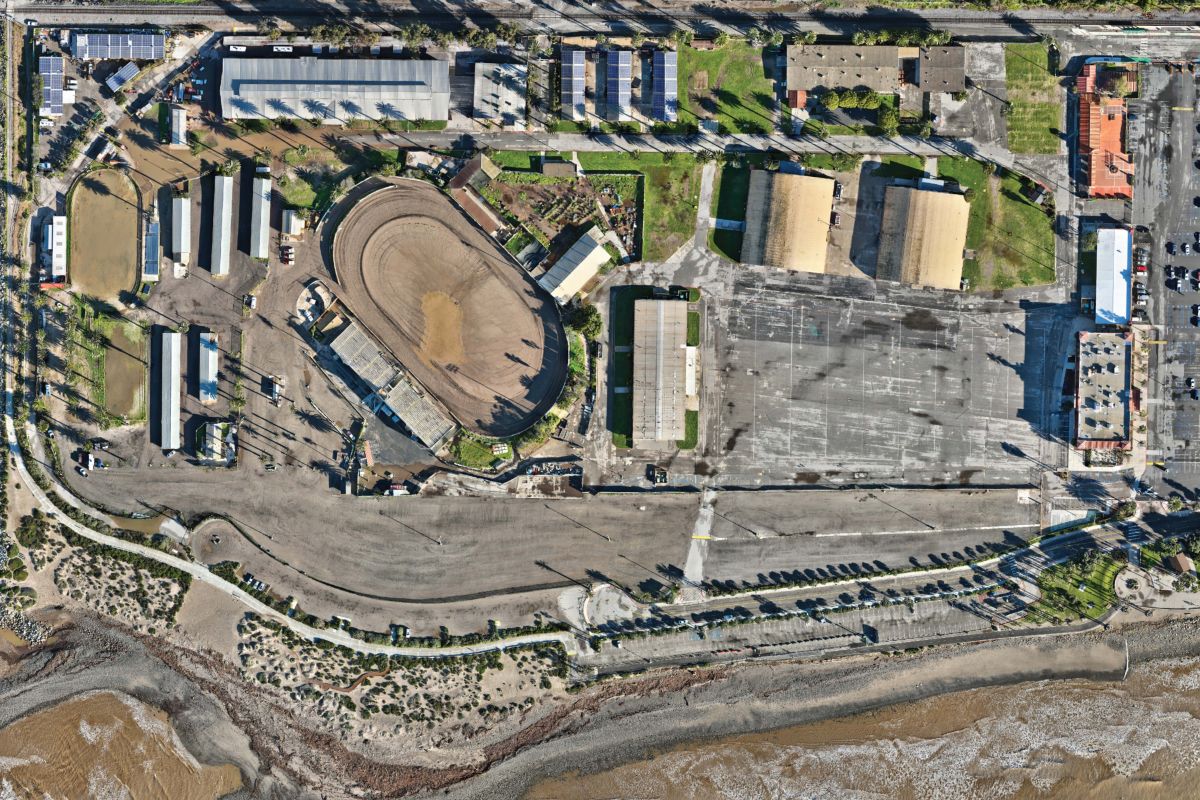
The orthomosaic is the one deliverable almost every mapping project includes. It's a high-resolution aerial image of the entire site, stitched together from hundreds of overlapping drone photos and geometrically corrected so it's accurate to scale — meaning you can measure distances directly on it.
Unlike a standard aerial photo, an orthomosaic is georeferenced: every pixel has a real-world coordinate attached to it. That means it can be imported directly into GIS platforms like ArcGIS or QGIS, overlaid on existing maps, or used as a base layer for design work. It's delivered as a GeoTIFF — a standard format that most engineering and GIS software can open natively.
For construction clients, the orthomosaic is often the most immediately useful output. You can see the whole site at once, track progress between flights, and share a clear visual with stakeholders who don't work with technical data. For real estate and land development, it's the foundation of any site documentation package.
Software like Agisoft Metashape and Pix4D are the industry-standard tools used to process drone imagery into orthomosaics and the other products described below.
Point Cloud
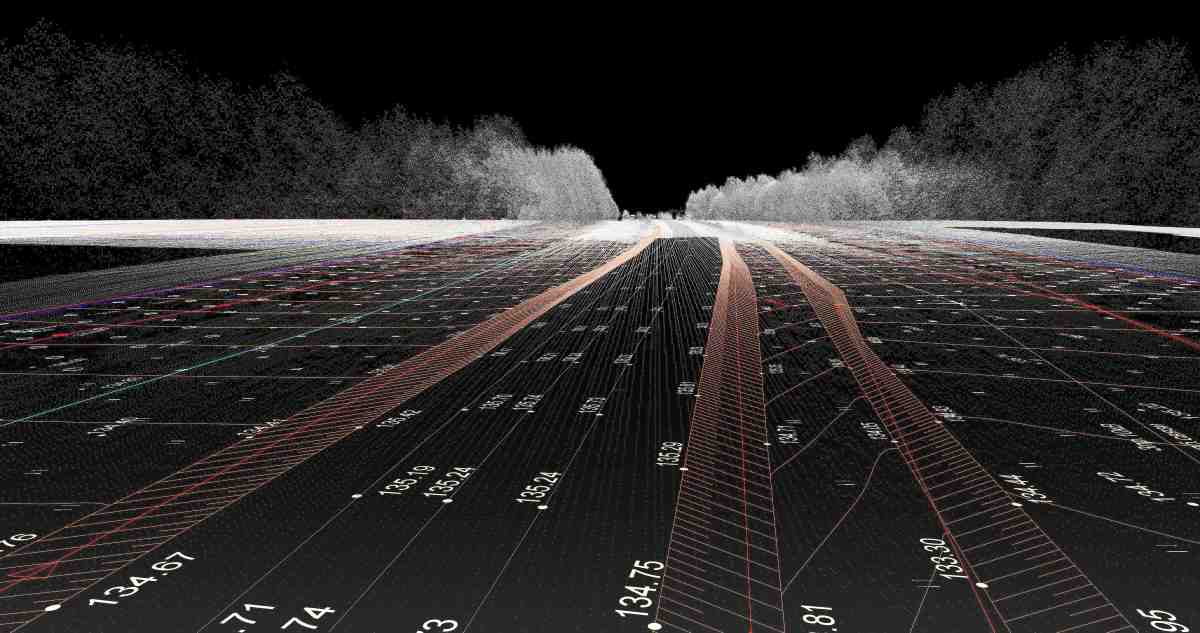
A point cloud is a dense collection of georeferenced 3D points — sometimes tens of millions of them — that together represent the surface of the site. Each point has an X, Y, and Z coordinate, and in photogrammetry-derived point clouds, each point also carries color data from the original imagery.
Point clouds are the raw material that most other 3D deliverables are derived from. They're delivered in LAS or LAZ format (the standard for lidar and photogrammetry point data) and can be opened in software like Global Mapper, CloudCompare, or imported into Civil 3D and BIM platforms.
For most construction and engineering clients, the point cloud is the input to everything else — elevation models, contours, volume calculations — rather than a final deliverable on its own. That said, some clients in structural inspection, heritage documentation, or complex 3D modeling work directly with the raw point cloud. Our LiDAR services produce dense point clouds that can be appropriate when vegetation penetration or project-specific control requirements matter.
DSM — Digital Surface Model
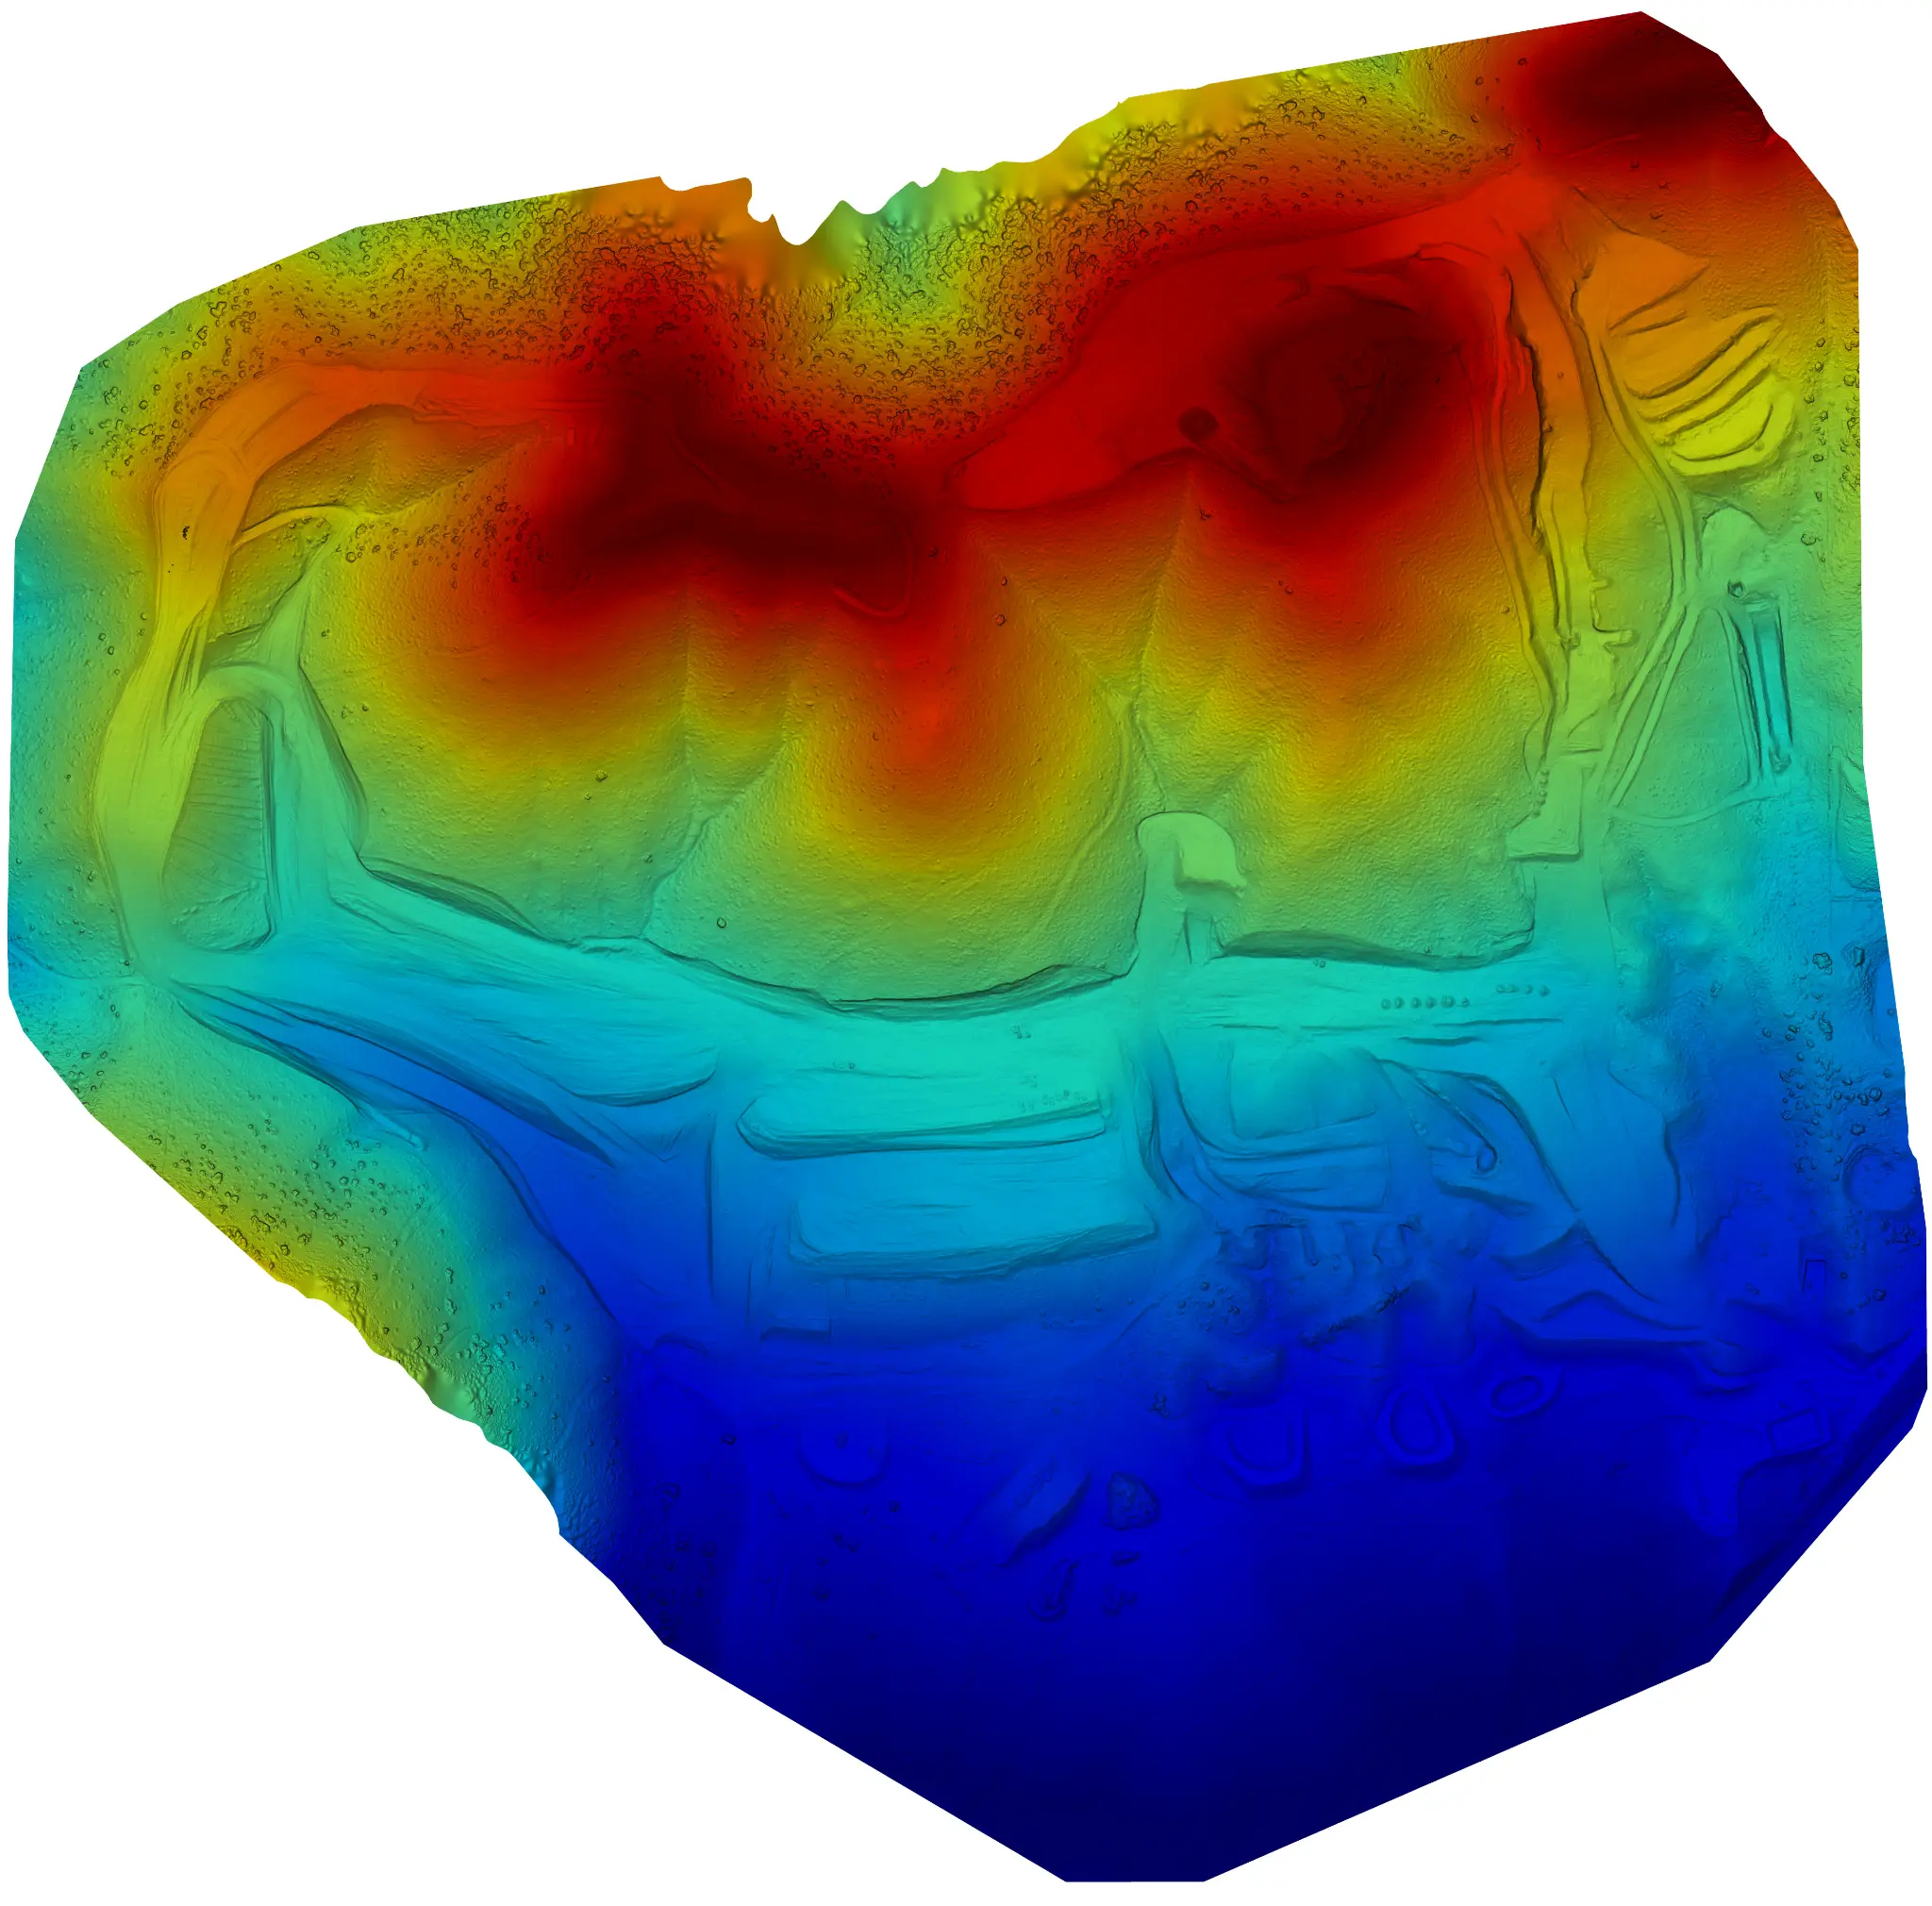
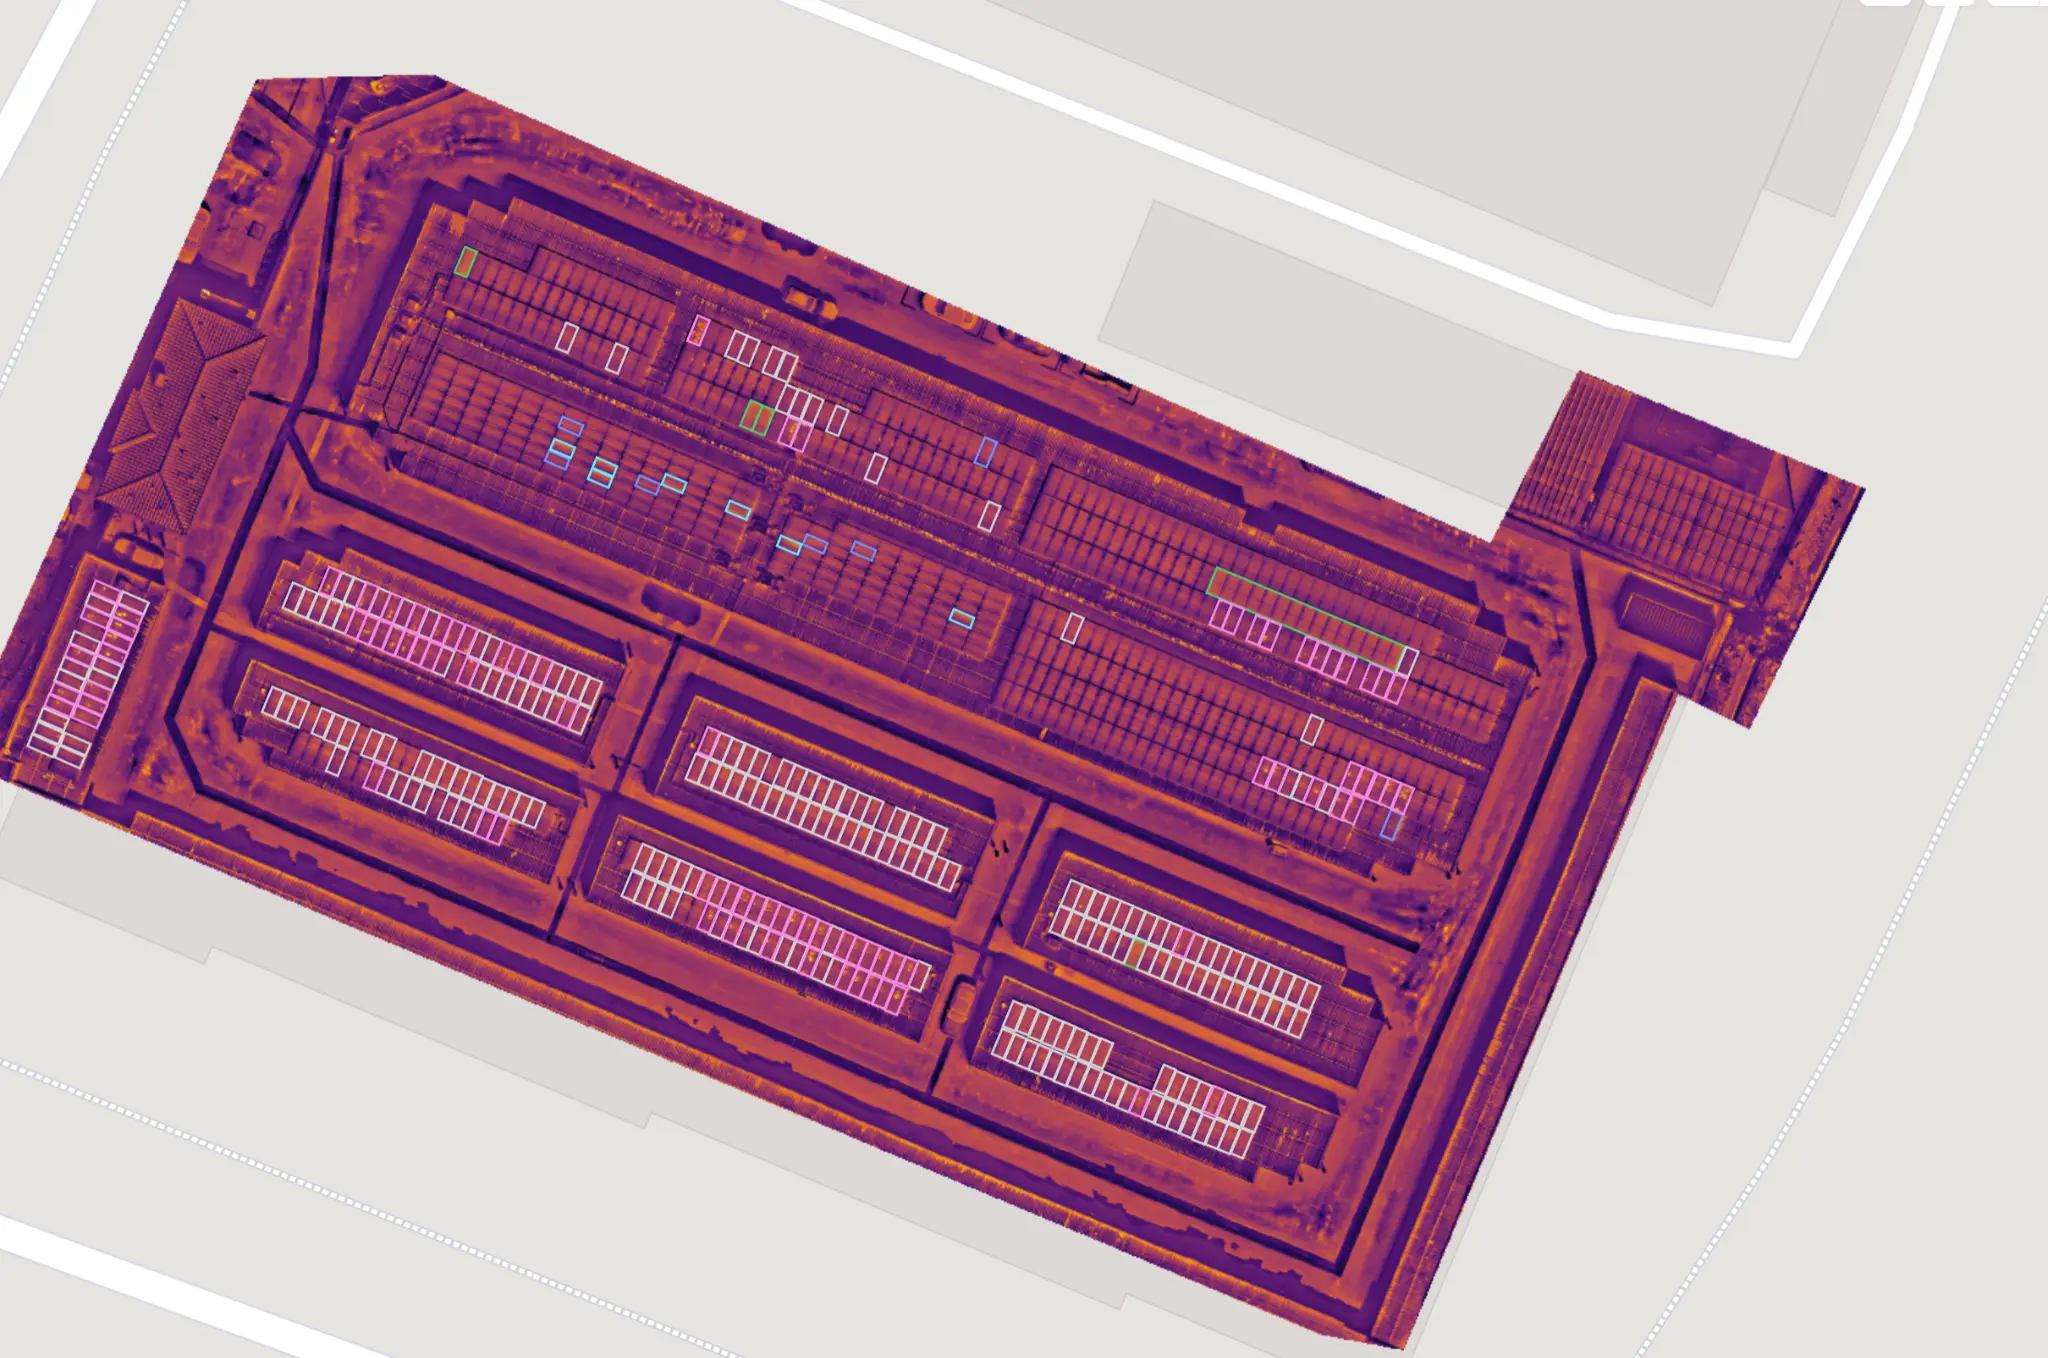
A Digital Surface Model (DSM) is a raster elevation grid that represents the top of everything the drone can see: the ground, buildings, trees, equipment, stockpiles. It's the "as-seen-from-above" elevation model, with no filtering applied.
The USGS defines digital elevation models broadly as raster representations of terrain, with DSM and DTM representing two distinct interpretations of that data. The DSM is the unfiltered version — useful when you need to know the height of structures, tree canopy, or surface features rather than just the bare ground.
Common uses: measuring building heights, analyzing solar obstruction from nearby structures or trees, documenting stockpile heights, and any application where the surface — not just the ground — is what matters.
DTM — Digital Terrain Model
A Digital Terrain Model (DTM) is the bare-earth version of the elevation data. Vegetation, buildings, and other above-ground features are filtered out, leaving only the ground surface. This is the product engineers and engineers typically need for grading design, drainage analysis, and cut-and-fill calculations.
On open, cleared sites — active construction pads, graded parcels, agricultural fields — the DTM and DSM are nearly identical because there's little above-ground clutter to filter. On vegetated sites, the difference can be significant. Photogrammetry-based DTMs struggle under dense canopy because the camera can't see through the trees; that's where LiDAR has a clear advantage, as laser pulses can pass through gaps in foliage to return ground hits.
DTMs are delivered as GeoTIFF rasters and can be imported into Civil 3D, ArcGIS, Global Mapper, or any GIS/CAD platform that handles raster elevation data.
Contour Lines
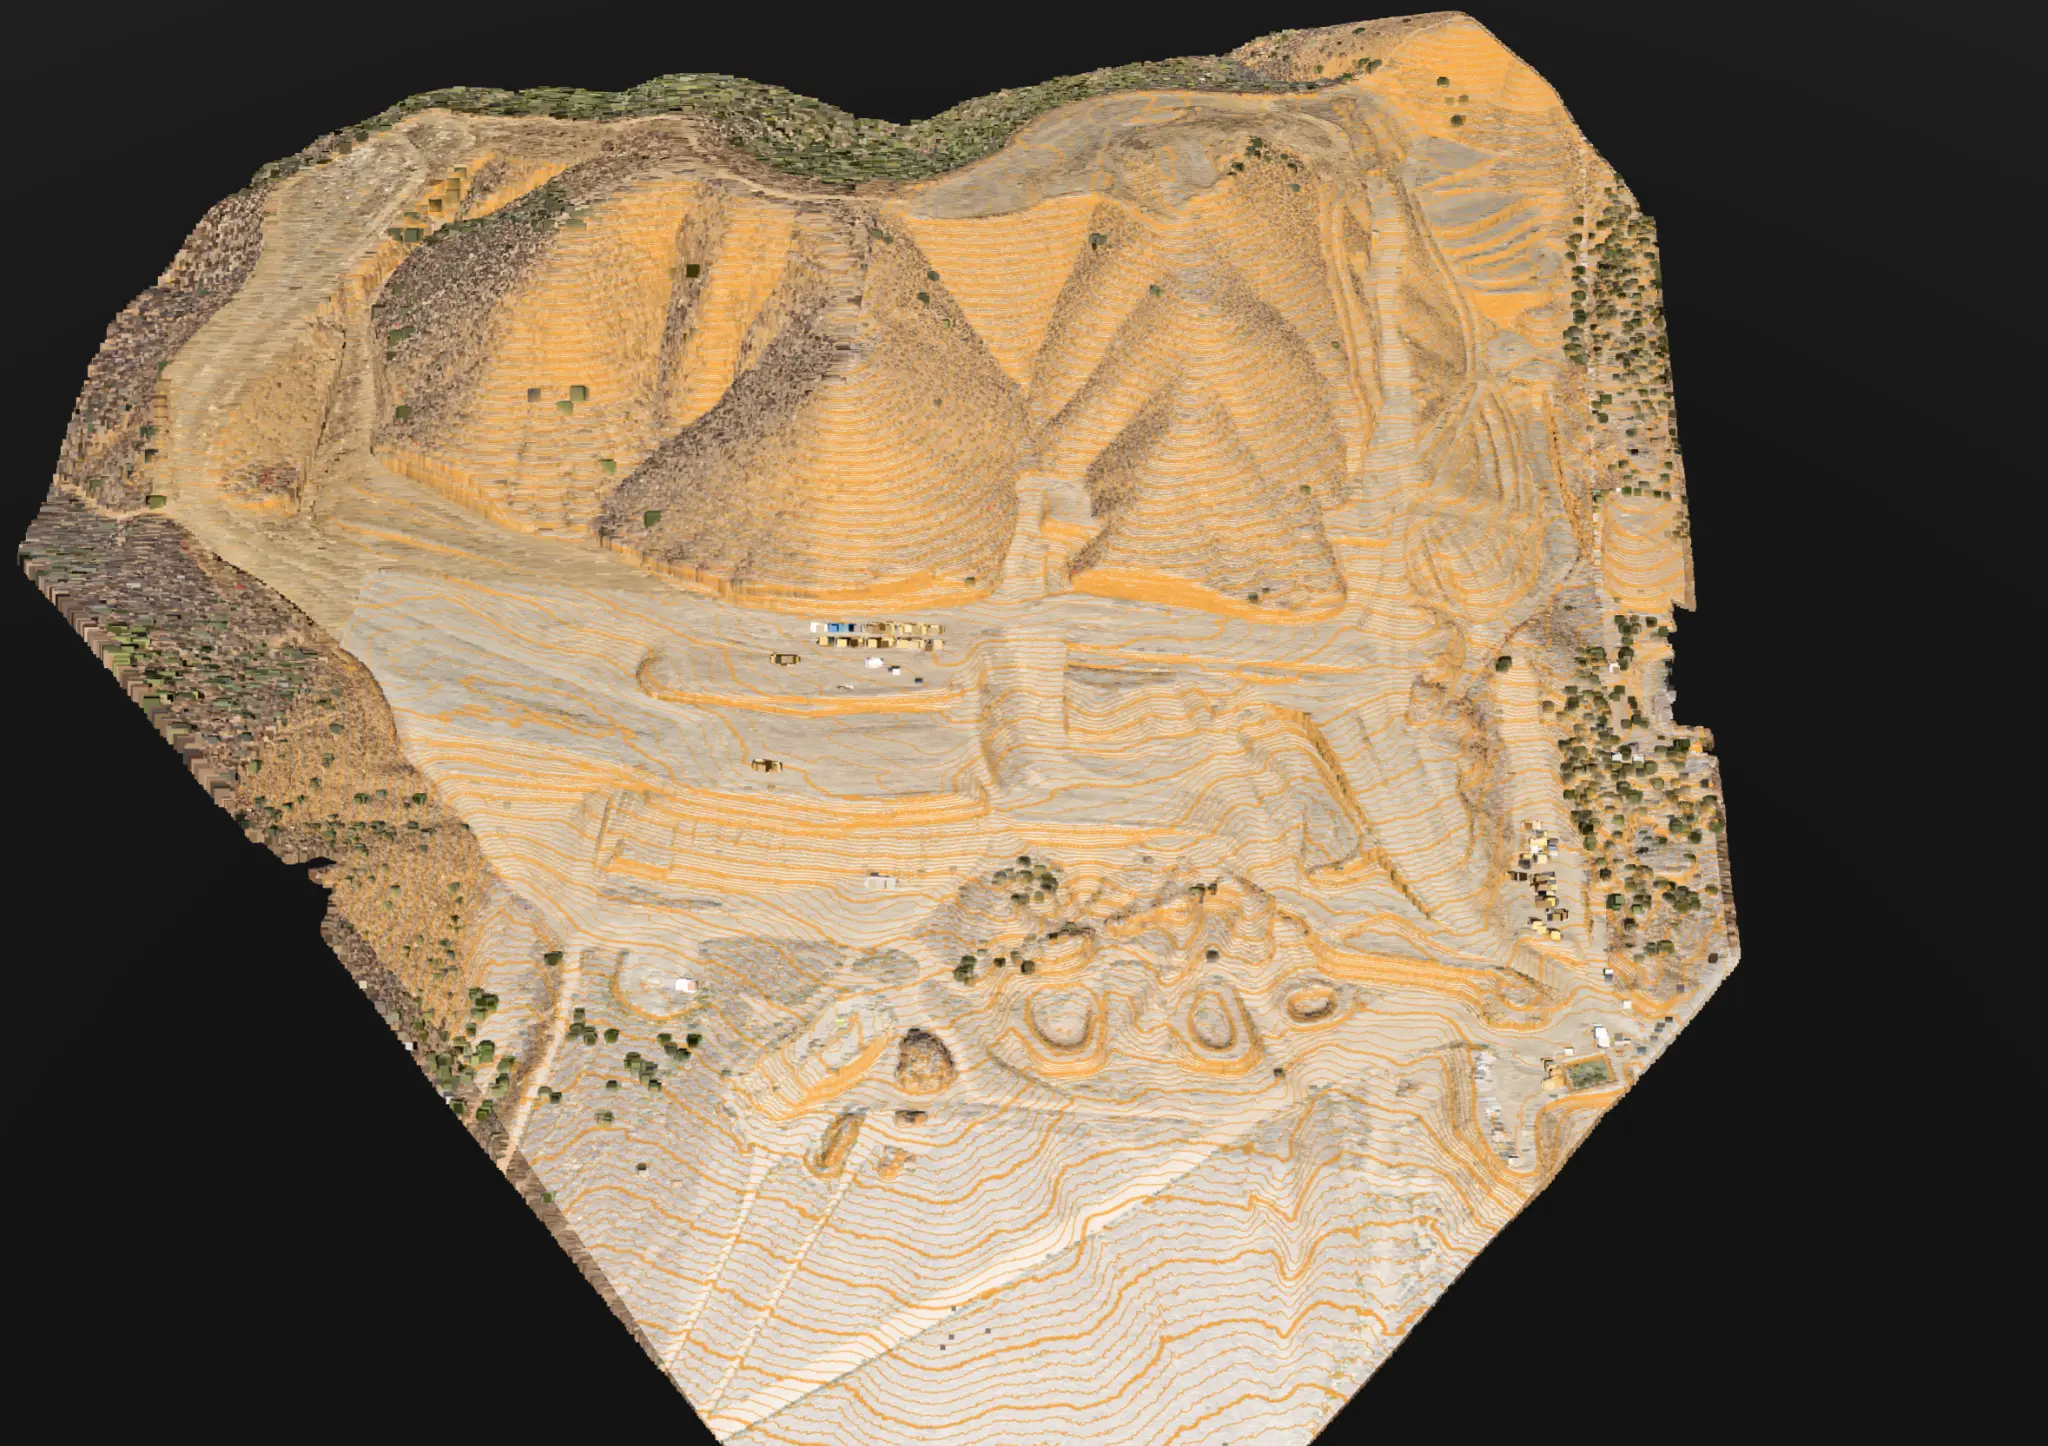
Contour lines are derived from the DTM and represent lines of equal elevation across the site. They're one of the most universally understood outputs in civil engineering and land planning — every grading plan, topographic map, and site plan uses them.
Contour interval is specified by the client based on the project's needs. For grading design on a construction site, 1-foot contours are standard. For a large land development project with significant terrain variation, 2-foot or 5-foot contours may be more practical. The contours are generated in post-processing using tools like Global Mapper and delivered as shapefiles or DXF/DWG for direct import into CAD.
For a real-world example of how contour data gets used in a land development context, see our case studies — the canyon parcel topographic mapping project is a good illustration of contour deliverables in practice.
CAD / DXF Files
CAD-ready deliverables — typically DXF or DWG format — are the engineering handoff. They contain the contour lines, breaklines, and surface data in a format that civil engineers can open directly in Autodesk Civil 3D or other CAD platforms without any conversion step.
For clients working in BIM workflows, Autodesk ReCap can ingest the point cloud directly and create a structured 3D reference model for use in Revit or Civil 3D. This is increasingly common on larger construction projects where the aerial data needs to integrate with the project's existing BIM environment.
The accuracy of CAD deliverables from drone mapping typically meets the requirements of most commercial and civil engineering applications. For projects with stringent accuracy requirements — boundary work, infrastructure design, or anything subject to professional engineering sign-off — the data is produced to ASPRS accuracy standards and accompanied by a processing report documenting the achieved accuracy.
3D Models
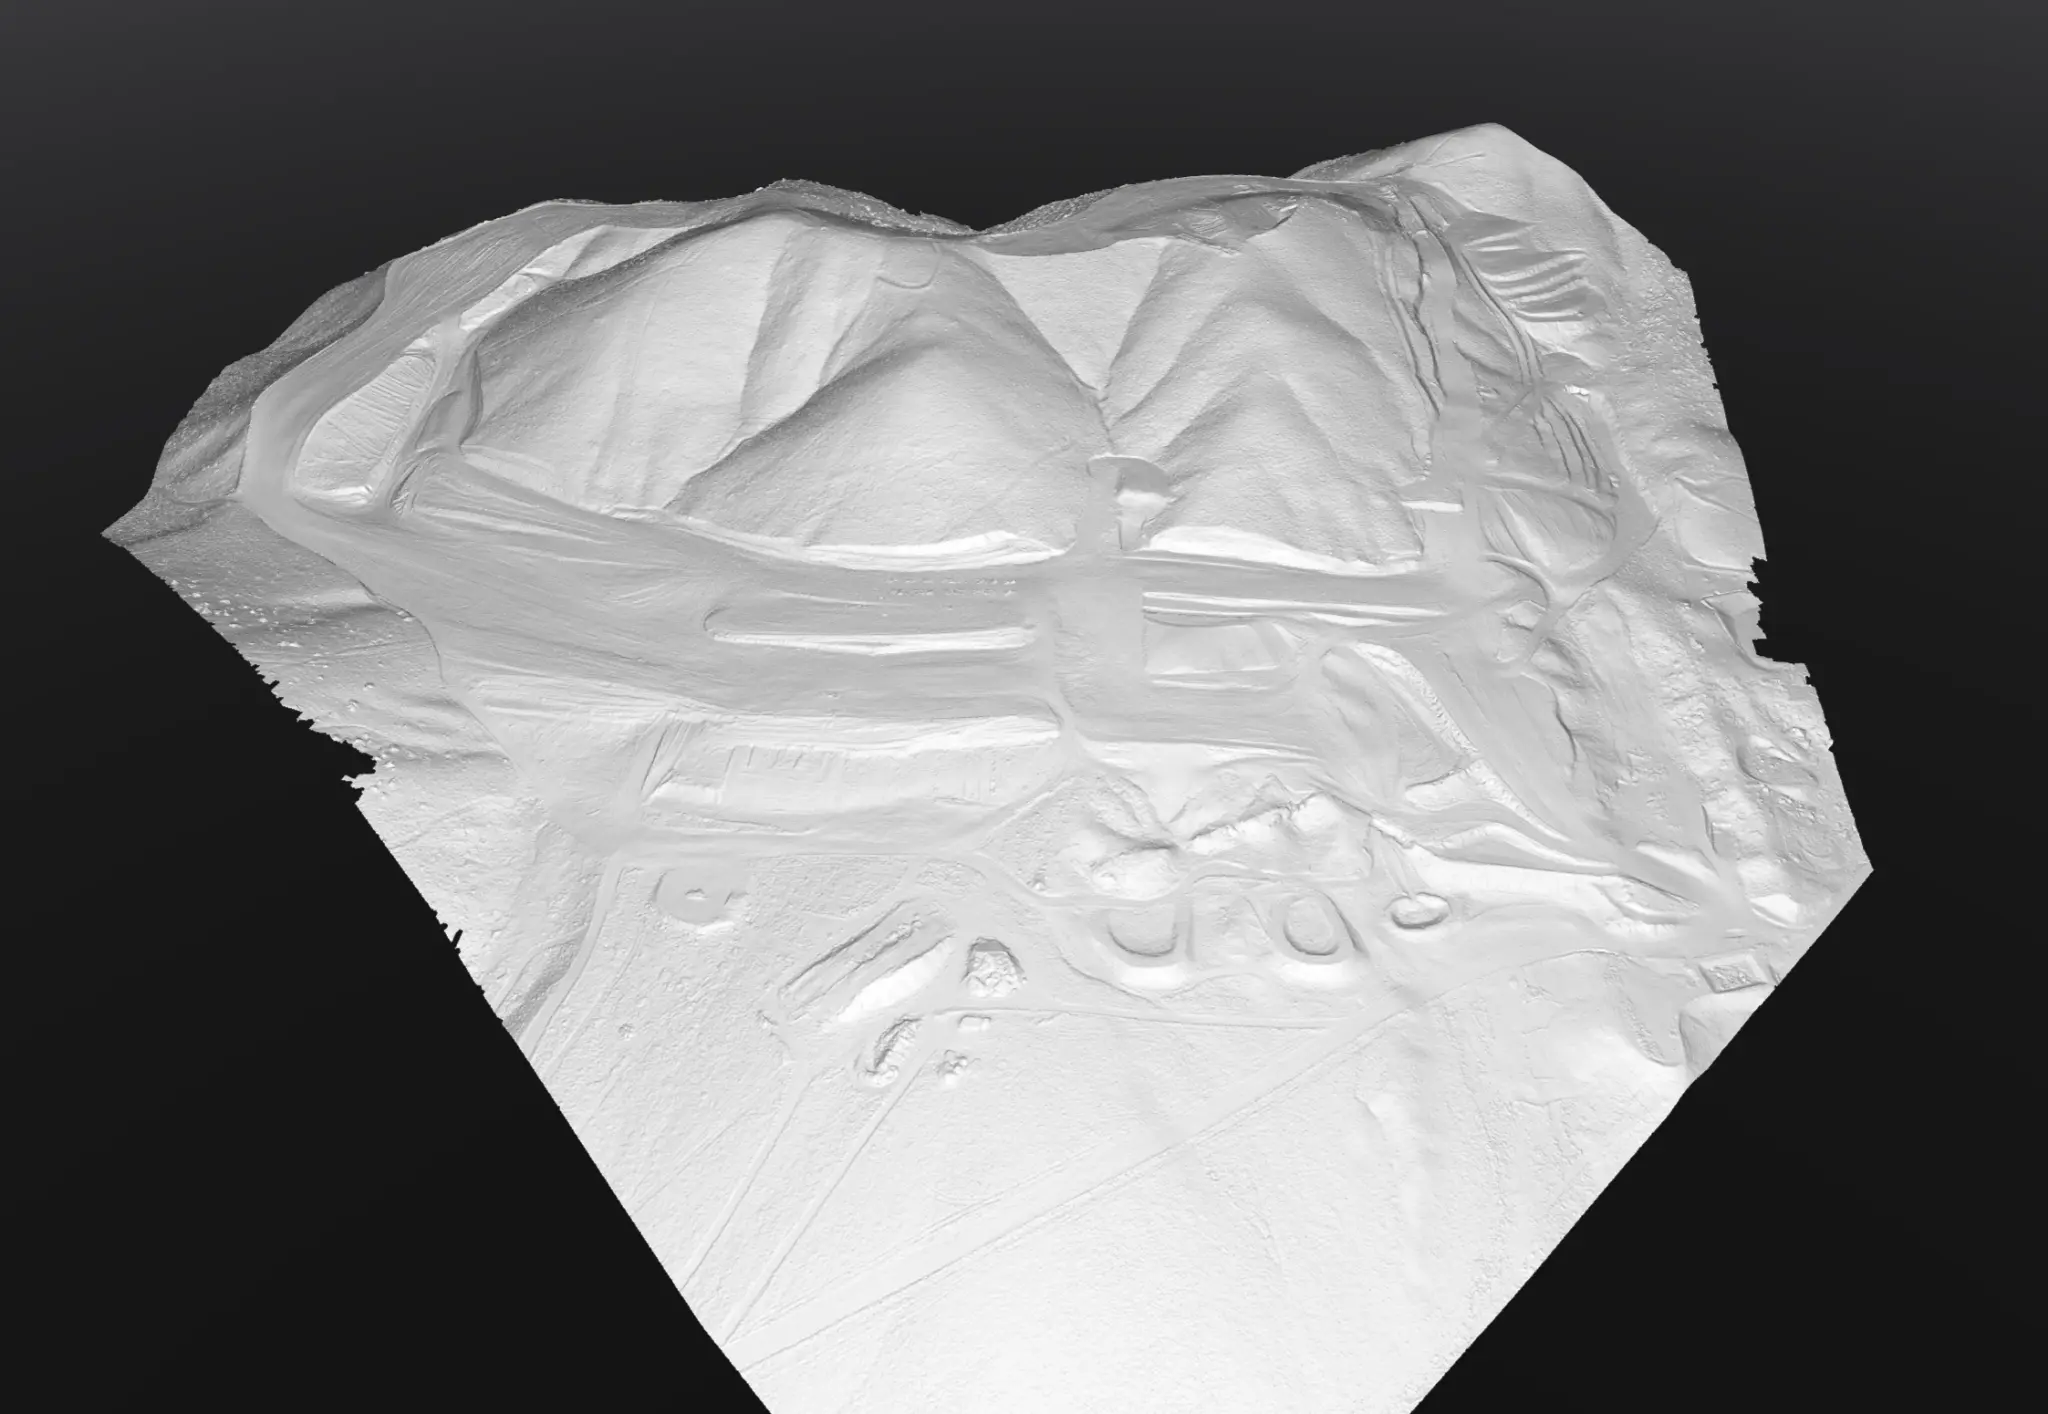
A 3D model — delivered as an OBJ, PLY, or FBX file — is a textured mesh representation of the site or structure. It's built from the same point cloud data as the elevation products, but rendered as a continuous surface with the original drone imagery draped over it as a texture.
3D models are the most visually compelling output from a mapping project. They're useful for client presentations, stakeholder walkthroughs, progress documentation, and any situation where you want to communicate spatial information to someone who doesn't work with technical data. They can be viewed in free tools like Sketchfab or imported into 3D visualization platforms.
For structural and infrastructure inspection work, 3D models also serve a practical function: they let engineers examine a structure from any angle without returning to the site, and they create a permanent visual record that can be compared against future inspections. Our infrastructure inspection projects often include 3D models alongside the inspection report for exactly this reason.
PDF Maps
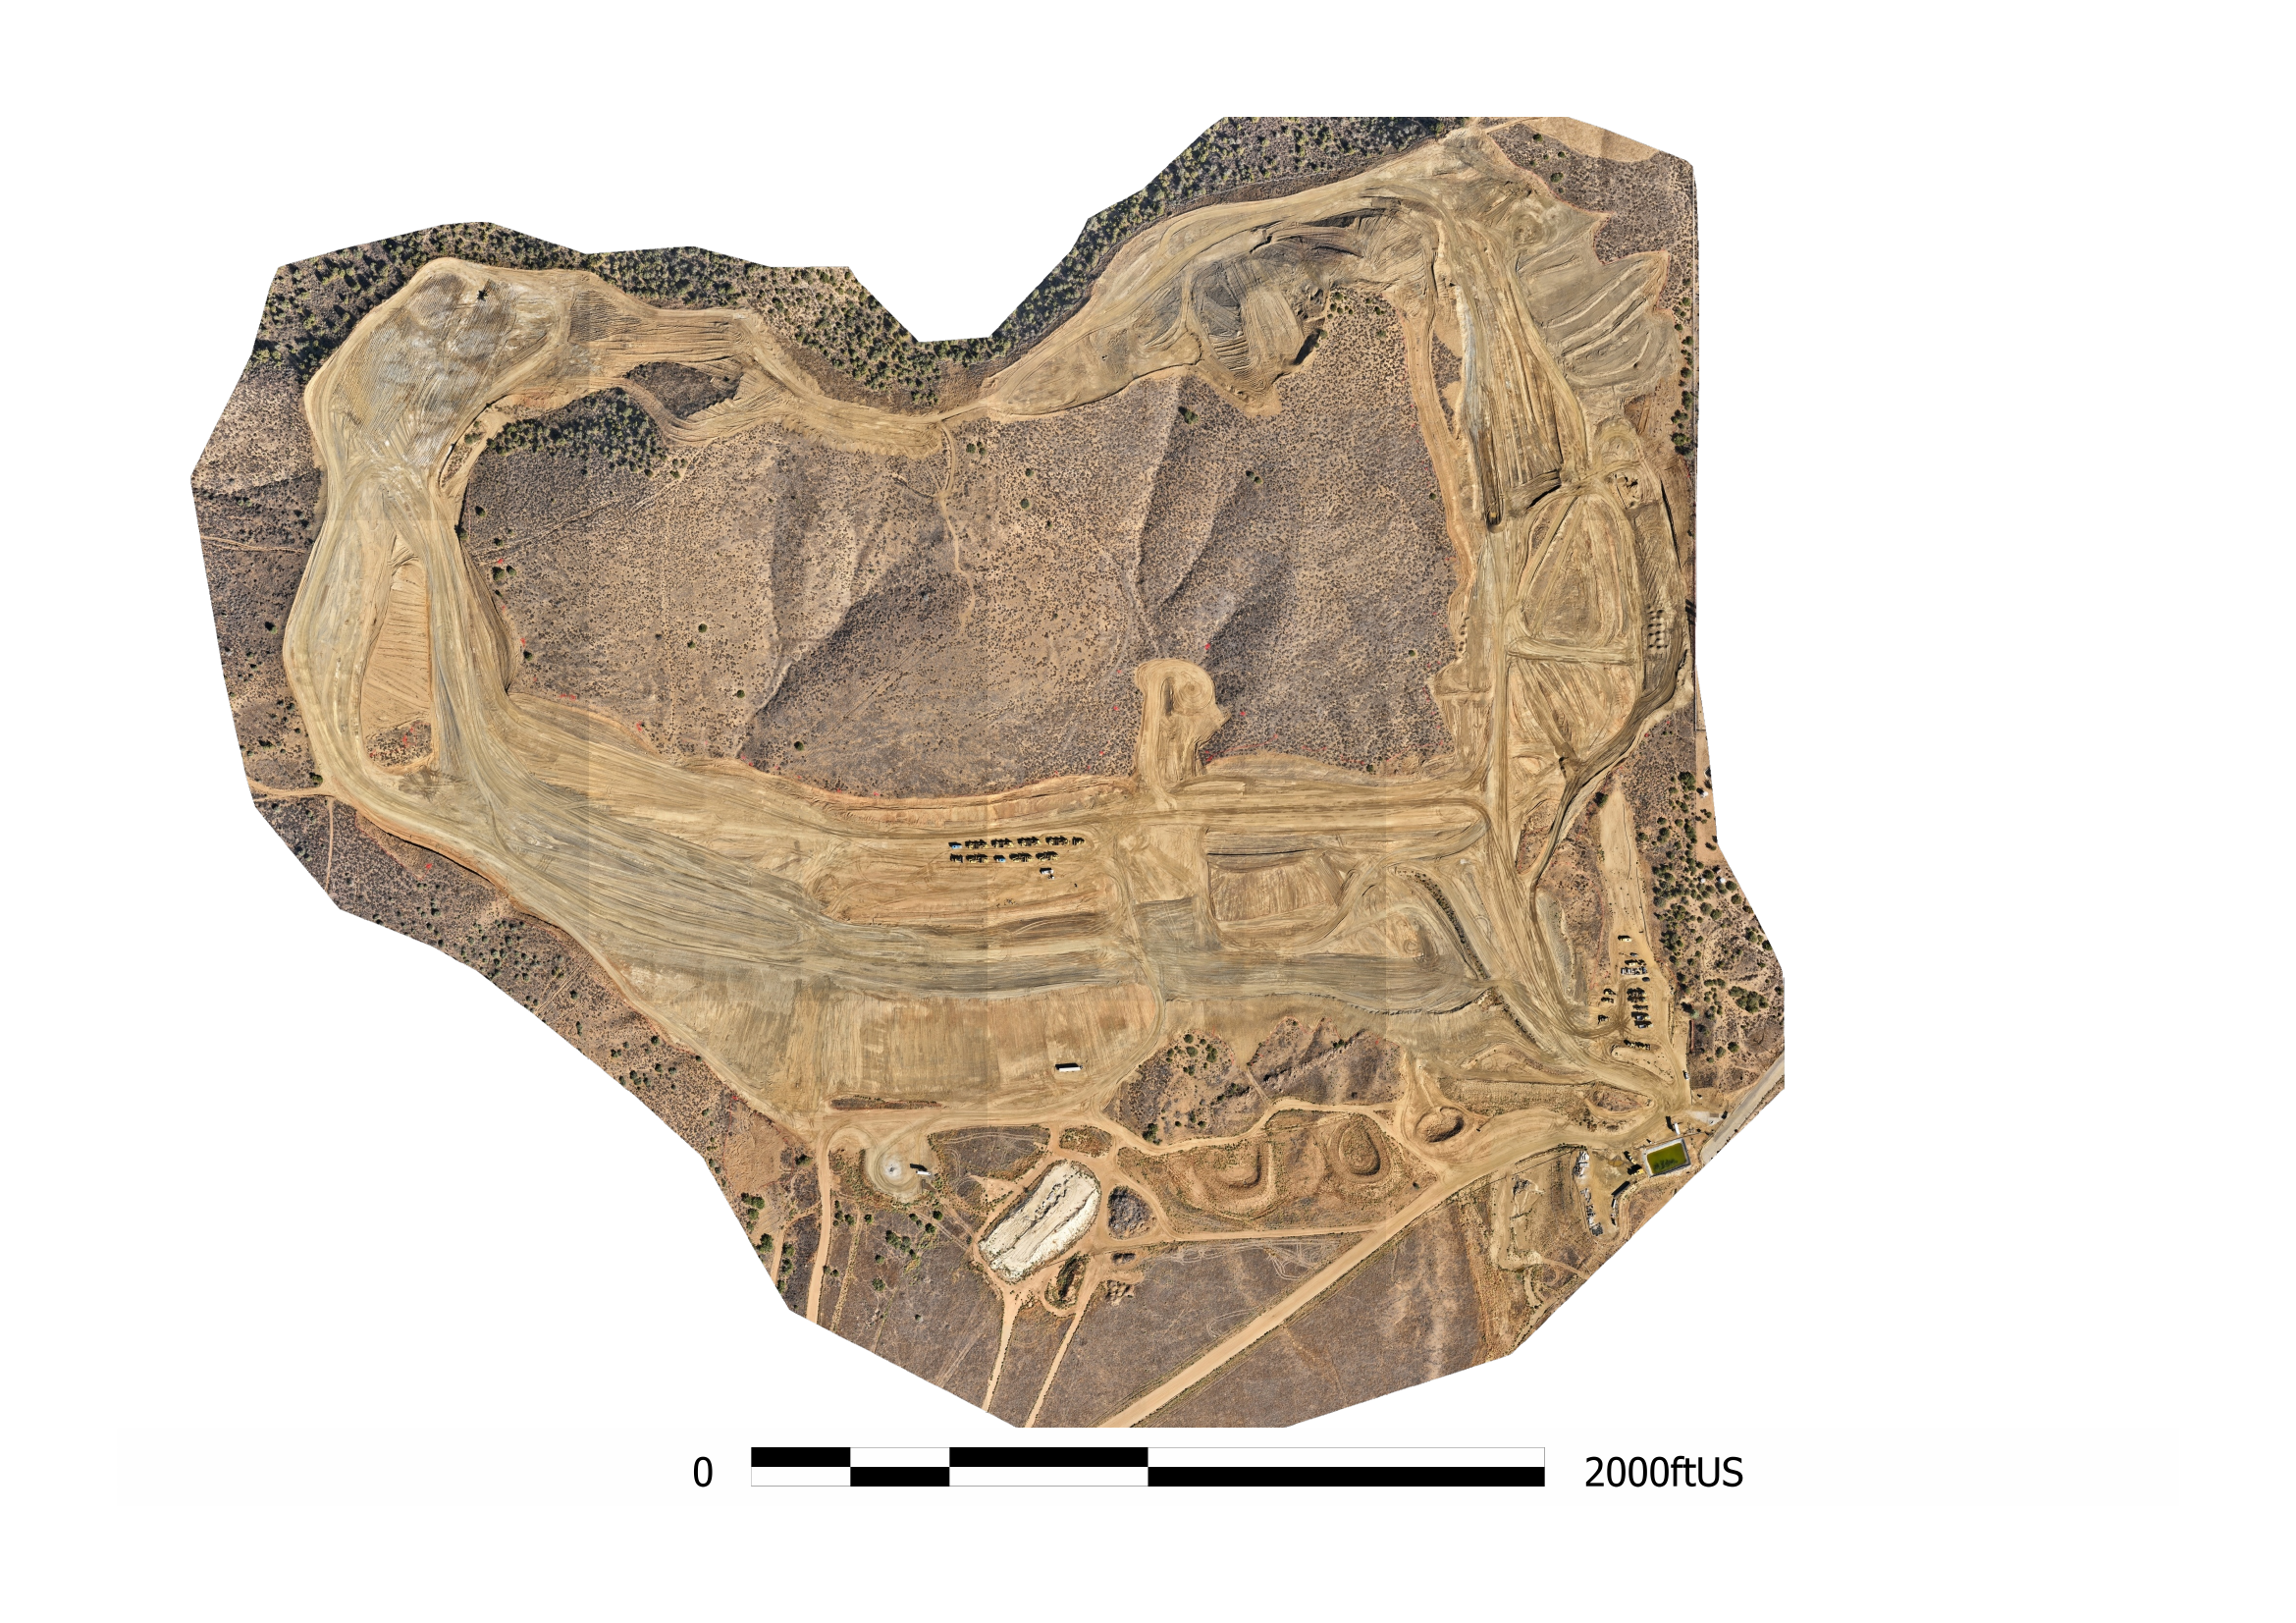
Not every client needs raw GIS or CAD files. For project owners, developers, or stakeholders who want a clear, print-ready document they can share without specialized software, we produce PDF maps: georeferenced orthomosaics with scale bars, north arrows, coordinate grids, and project annotations laid out for presentation or reporting.
PDF maps are also useful for regulatory submissions, HOA documentation, permit applications, and any situation where the data needs to be communicated in a format that a non-technical audience can review and sign off on. They're typically delivered alongside the technical files rather than as a replacement for them.
How It All Fits Together
Most projects don't require every deliverable listed above. A construction progress monitoring engagement might need only the orthomosaic and a volumetric report. A land development project might need the DTM, 1-foot contours, and a DXF for the civil engineer. A client presenting to investors might prioritize the 3D model and PDF maps.
At the start of every drone mapping project, we confirm exactly which deliverables you need and format them for your specific workflow — whether that's AutoCAD, Civil 3D, ArcGIS, or a simple folder of files your team can open without any GIS background. The goal is data that's immediately useful, not a ZIP file full of formats you have to figure out.
If you have a project coming up and want to talk through what makes sense for your scope, reach out here or call (805) 222-7858. A 10-minute conversation usually gets us to a clear answer.